FTA Original Research
We rebuilt the perfect lineup for 163 DraftKings NFL Showdown slates across the 2024 and 2025 seasons, then checked every popular showdown rule against what actually won. Some of them hold up. One of the most repeated rules in the industry deletes the winning lineup in four out of every ten slates.
Showdown is the most brutal format in daily fantasy. Six roster spots, one game, and a field that is usually large enough that finishing second is worth roughly nothing. Winning a big showdown contest almost always means building the single best possible lineup out of the entire player pool. Not a good lineup. The best one.
That fact makes showdown unusually studyable. If the target is the perfect lineup, and the perfect lineup can be reconstructed after the fact from final box scores and salaries, then you can go back through every showdown slate ever played and ask a simple question: what did the perfect lineup actually look like?
So we did. Here is what 163 of them say.
Method, in one paragraph
For every slate we took the full DraftKings showdown player pool with its real salaries, the pregame FTA projections and projected ownership, and the actual DraftKings points every player scored. Then we solved for the highest-scoring valid lineup: one captain at 1.5 times points and 1.5 times salary, five flex, a $50,000 cap, and at least one player from each team. That optimal lineup is what we call the nut lineup. Every number below describes those 163 nut lineups, not lineups that merely cashed.
1. The captain is not who you think
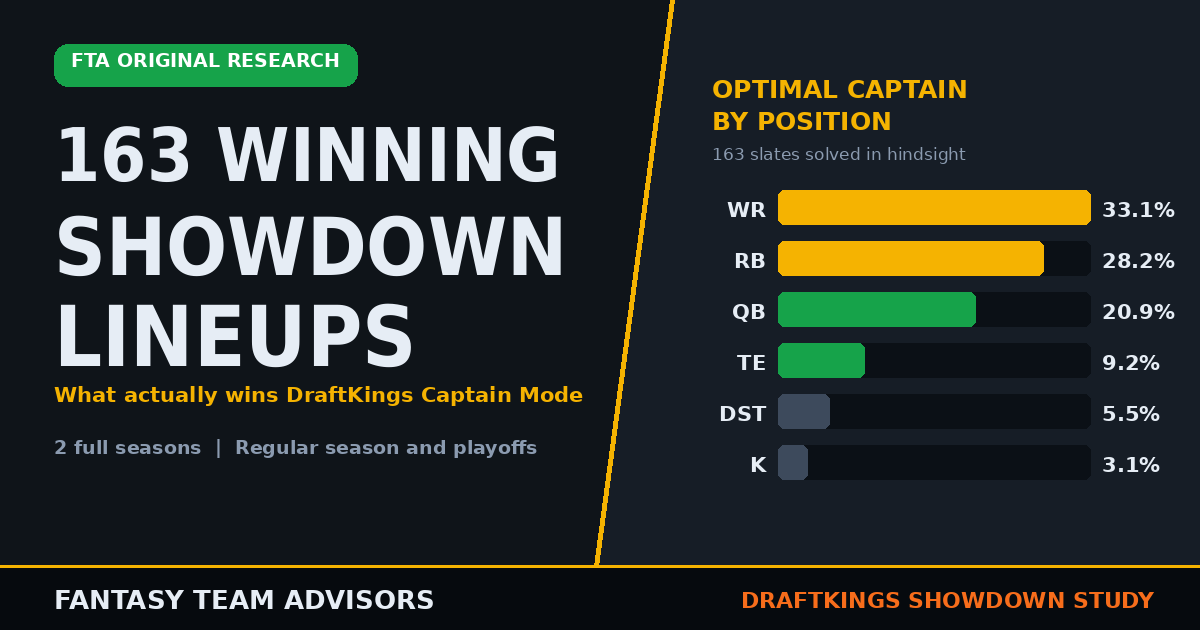
Across all 163 slates, here is how often each position ended up as the optimal captain.
Nut lineup captain by position
163 DraftKings showdown slates, 2024 and 2025 seasons
The quarterback is the most popular captain in almost every showdown field you will ever enter. He is the optimal captain about one time in five. Wide receivers and running backs together account for over 61 percent of nut lineup captains.
This is the single easiest edge in the format and it is available to anyone who simply stops defaulting to the quarterback.
Captain position by game environment
Split the slates by closing total and the picture sharpens.
Total 42 or lower
26 slates
Total 42.5 to 48.5
101 slates
Total 49 or higher
36 slates
Bars are scaled to a common 50 percent maximum, so the three cards are directly comparable.
Low totals push you toward running backs, because in a game that stays in the 30s the volume player who gets 22 touches is the safest route to a ceiling. High totals push you toward receivers, because that is where the outlier games live. Quarterback captain rates barely move between the two, which is worth sitting with: a shootout is not a reason to captain the quarterback.
2. The spread tells you more than the total
Everyone builds showdown lineups off the total. The spread is the more useful of the two numbers, and it is not close.
How often the nut lineup captain came from the favorite
By closing spread
In games with a spread bigger than a touchdown, the optimal captain came from the favorite 80 percent of the time, and it was a running back 44 percent of the time. That is the cleanest single rule in this entire study. Big favorite, captain the back, and you are on the right side of history four games in five.
The overall rate across all 163 slates is 64.4 percent on the favorite. Even in a pick’em, the favorite is where the captain lives about two thirds of the time.
You still need both teams
A common mistake is reading captain the favorite as stack the favorite. The winning lineups are almost never one sided.
Players from the favorite in the nut lineup, out of six
A three or four split covers 65.7 percent of nut lineups. Going five or six deep on one side hit 10.4 percent of the time and going one deep hit 2.5 percent. Showdown rewards the team that scores, but it rewards the game that gets played even more.
3. Kickers and defenses belong in your pool
These two positions get cut from showdown pools more than any others, usually on the reasoning that they have no ceiling. We keep both live on the NFL Bacon Station board for exactly the reason below.
Two out of every five perfect lineups included a kicker. Nearly one in three included a defense. They are rarely the captain, and that part of the conventional wisdom is correct, but as flex pieces they are not filler. They are cheap, they scored, and they freed up the salary that made the rest of the lineup possible.
4. Stop forcing max salary
Optimizers default to spending every dollar. The perfect lineup usually does not.
Salary left unspent by the nut lineup
Only 7.4 percent of nut lineups used the full $50,000. The median left $1,400 on the table and nearly three in ten left $3,000 or more. If your build process rejects a lineup because it is $900 under the cap, your process is rejecting the most common shape a winner takes.
5. The rule that costs people the most money
Here is the finding we did not expect, and the reason this study exists.
A rule you will hear repeated constantly is that low projected ownership signals a player nobody should roster. Various versions circulate, but the shape is always the same: if a player is projected for very low ownership, or very few points, cut him from the pool before you build. It is presented as a way to clean up your player pool.
How often the nut lineup contained a player the screens would have deleted
163 slates
41.1 percent of perfect showdown lineups contained a player projected for under 3 percent ownership. More than one in five contained a player under 1 percent. Nearly 13 percent contained a player projected for less than a single fantasy point.
Deleting those players from your pool does not clean it up. It guarantees you cannot build the winner in four out of every ten slates you enter.
The median lowest-owned player in a nut lineup sat at 3.84 percent projected ownership. That is the actual shape of a showdown winner: mostly recognizable pieces, plus one player almost nobody rostered.
What ownership actually looked like
Total projected ownership of the nut lineup
Across all six roster spots, 163 slates
Number of slates in each band.
Median total was 167.4 percent across six roster spots, with a full range from 83 to 239. Captain ownership tells the same story: the median optimal captain was projected for 10.9 percent, but 27.6 percent of slates had a captain projected under 5 percent and 16 percent had one over 20 percent. There is no magic ownership number. There is a wide middle and two long tails.
6. The part nobody publishes: these numbers move
Every showdown study you have read presents one pooled table of captain rates, as though the numbers were physical constants. We split our sample by season to check. They are not constants.
What moved between seasons
Captain position is not stable
The wide receiver captain rate swung twelve points between two consecutive seasons. If you had memorized the 2024 table, you spent 2025 slightly wrong.
Now look at what did hold.
What held between seasons
The structural findings barely budged
This is the real lesson of the study. The structural findings transfer between seasons. The position splits do not. Personnel changes, offensive philosophy shifts, one team running back gets 400 touches and the whole distribution tilts. But the geometry of the format stays put, because it comes from the scoring system and the salary cap rather than from who happened to be good last year.
So use the structural rules as rules. Treat any position-rate table, including ours, as a description of a specific two seasons rather than a law of the format. That is also the argument for building off numbers that recompute every week instead of a table you downloaded once, which is what the BaconLab Optimizer and the DFS Leverage Report do for every slate on the board.
The rules we would actually play
- Captain the favorite, especially when the spread is over 7. 80 percent hit rate in that band, 64.4 percent overall.
- Get off the quarterback captain. Optimal about 21 percent of the time, rostered far more often than that in every field.
- Let the total pick the position. Low totals lean running back at 46 percent, high totals lean wide receiver at 47 percent.
- Build a three or four split. Two thirds of perfect lineups take that shape. One sided builds are the exception, not the plan.
- Keep the kicker and the defense in your pool. They appear in 40.5 and 31.3 percent of winners respectively.
- Do not force max salary. Only 7.4 percent of winners spend it all.
- Never cut a player for low projected ownership. Four in ten winners contain one. Cut players with no projection at all instead, which costs you 1.2 percent.
Put these rules to work on the next slate
The FTA tools the numbers above come from
- BaconLab Optimizer: build showdown and classic lineups off live projections, with ownership baked in so you can find the sub-3 percent piece instead of cutting it.
- NFL Bacon Station: the full research board for every slate, including the projections and projected ownership used throughout this study.
- DFS Leverage Report: where the field is over and under rostering, which is exactly the gap the ownership section above describes.
- NFL WR vs CB Matchups: receiver captains won 33 percent of these slates, and this is where you find the ones with the softest coverage draw.
- NFL Depth Charts: confirm the workload before you captain a back in a big-spread game.
- NFL DFS Strategy Guide: the full-slate companion to this single-game study.
- All FTA DFS Tools: every board across MLB, NFL, NBA, PGA, NASCAR and MMA.
Data and definitions
Nut lineup: the highest-scoring valid DraftKings Showdown Captain Mode lineup available in hindsight. One captain at 1.5x points and 1.5x salary, five flex, $50,000 cap, minimum one player from each team.
Sample: 163 DraftKings showdown slates, September 2024 through February 2026, covering regular season and playoffs including two Super Bowls.
Scoring: actual DraftKings NFL scoring. Where a slate file lacked final scores, points were rebuilt from official play-level data and validated against the slates that did have them, agreeing on 98.8 percent of player games.
Game classification: closing total and closing spread. Grind is 42 or lower, average is 42.5 to 48.5, shootout is 49 or higher.
Projections and ownership: FTA projections, captured pregame.
Build on numbers that update every week
The structural rules above hold season to season. The position splits do not, which is exactly why we run these numbers fresh for every slate instead of shipping a static table. FTA+ members get the showdown pools, projections and ownership behind this study for every game on the board.
Join FTA+